
The Apecoin price shows a splendid bullish muscle as it has skyrocketed 2%, with the APE/USD trading at $0.8546. The growing interest in the token has seen the trading volume spike by 39% to $58 million, indicating a recent rise in market activity. APE is now up 8% in a week and 19% in a month. However, the Apecoin price is down 24% in a year.
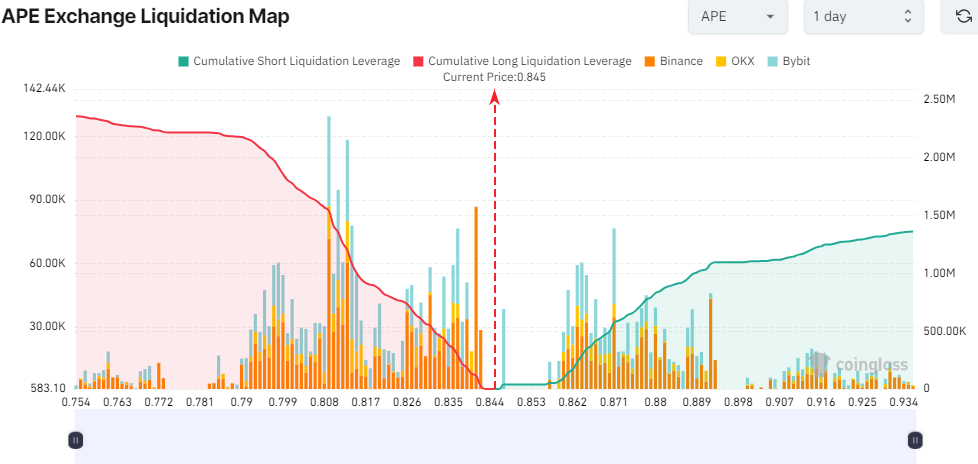
Apecoin is an ERC-20 governance and utility token used to empower a decentralized community building at the forefront of web3. Moreover, all hope is not lost in the Apecoin market, as Coinglass data indicates some bullish prospects in the market. This is evident as there have are more long liquidations compared to short ones in the past 24 hours. In other words, this suggests that investor confidence is growing in the market.
Advertisement

Apecoin Statistical Data
Based on CoinmarketCap data:
- APE price now – $0.8546
- Trading volume (24h) – $58 million
- Market cap – $510 million
- Total supply – 1 billion
- Circulating supply – 604 million
- APE ranking – #117
Apecoin Price Aims for a Break Out Above the Rising Channel
The Apecoin price trades well within the confines of a rising channel as the bulls build bullish muscle. APE price has printed a big green candle, whose wick has hit the $0.8546 mark. Over the last 24 hours, the bulls have put their best feet forward, quashing the selling pressure and supporting an impressive rally to $0.854.
Meanwhile, APE has stepped above all two key moving averages, including the 50-day Simple Moving Average (SMA) (green) and 200-day SMA (blue), steadying the uptrend and allowing bulls to stay in control. Meanwhile, the bulls have immediate support at $0.7189 and $0.7981, leaving the Apecoin price in a resistance-free zone.
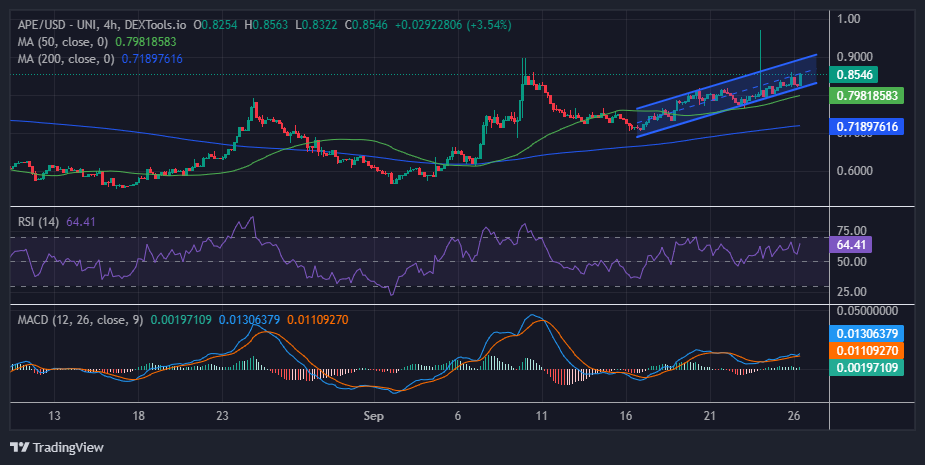
The Relative Strength Index (RSI) also upholds a bullish picture, as it sits well above the 50-mean level. It has jumped to 64, almost hitting a 70-level strength. In the case of APE stepping into the overbought zones, traders won’t have to worry about sudden pullbacks, as the bulls will slightly retrace in search of enough liquidity before a substantial leg up.
On the other fence, the Moving Average Convergence Divergence (MACD) indicator upholds the bullish picture. This call to traders to consider buying APE manifested with the MACD line in blue, crossing above the orange signal line. As the momentum indicator gradually ascends above the mean line (0.00) into the positive region, the path with the least resistance stays on the upside.
How High Can the Apecoin Price Go?
In the 4-hour chart above, the Apecoin bulls are leaving no stone unturned as they take the reigns in the market. Meanwhile, the price could surge if the buyers capitalize on the MACD and RSI, which calls for traders to hold long positions in the APE market. On the upside, the bulls can initiate a meaningful upswing, causing the Apecoin price to reclaim $1.
On the downside, if the bears step in and the whole crypto market turns negative, the Apecoin price could drop. In case of a pullback, the support provided by the 50-day SMA at $0.7981 would be instrumental in bulls desiring to arrest the bearish situation. Otherwise, investors may have to acclimatize to losses extending to the next support at $0.7189, coinciding with the 200-day SMA.
Advertisement