

The Pepe price has jumped to the green zone, boasting a 2% increase today, with the PEPE/USD trading at $0.0000084. Accompanying the noticeable price movement is the 24-hour trading volume, which has surged 87% to $926 million, signaling intense market activity. The frog-themed meme coin is now up 16% in a week despite a slight plunge of 6% in a month. Moreover, the Pepe price is up 1114% a year, gaining a spot among the fastest-growing meme coins.
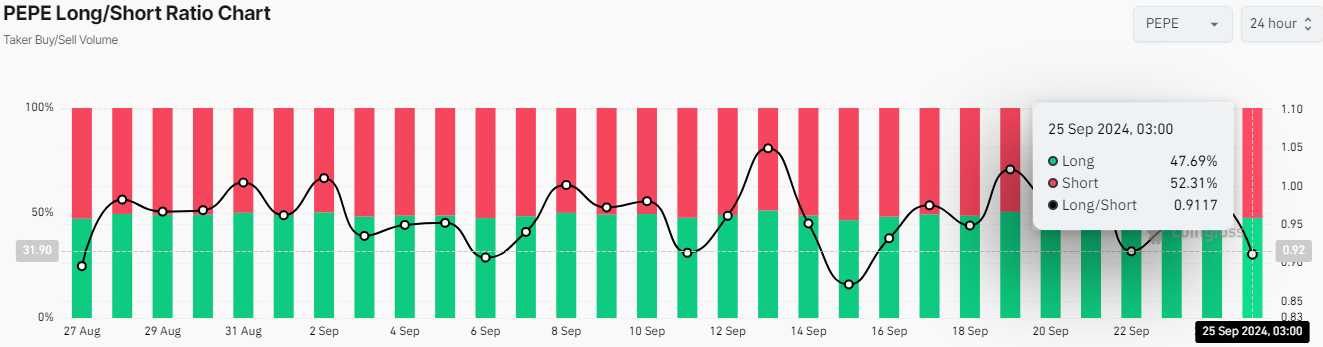
Despite the bullish outlook, data from Coinglass suggests a slight momentum fall. The Pepe price is, however, on the borderline of reinforcing its leg up if the bulls show resilience in the market. Pepe’s Long/Short Ratio has plunged to 0.91, slightly below 1. In other words, if the reading rises above 1, the average open position is bullish, while a reading below the value suggests a bearish stance.
Advertisement

Meanwhile, all hope is not lost, as investors and traders are optimistic about the crypto prices surging in the coming week. According to Crypto Zeus, a well-known investor has noted that the Pepe price is looking bullish, and so is the rest of the crypto market. He has further added that “a big week for crypto is ahead.”
$PEPE Is Looking Bullish Today 🐸👀 And so is the rest of the crypto market 🔥 A Big Week For #CRYPTO Ahead 🌄
Check out the latest #PEPE News here 👇📺 pic.twitter.com/5Iz8El4HyT
— Crypto Zeus ⚡ (@CryptoZeusYT) September 25, 2024
Pepe Statistical Data
Based on CoinmarketCap data:
- PEPE price now – $0.0000084
- Trading volume (24h) – $926 million
- Market cap – $3.55 billion
- Total supply – 420.69 trillion
- Circulating supply – 420.69 trillion
- PEPE ranking – #28
Pepe Price Upholds a Bullish Picture: How High Can PEPE Reach?
Despite a slight correction, the frog-themed meme coin is still moving bullishly in tandem with the crypto market. As expected, some investors who bought in the range channel commenced early profit-booking activities, leading to a slight retracement. However, the bulls are still holding on, painting the PEPE market as bullish. Moreover, the golden cross pattern on the 4-hour chart affirms the bullish grip. This pattern appears when a short-term moving average, like the 50-day SMA, moves above a long-term moving average, like the 200-day SMA.
Currently, the Pepe price is sitting on top of confluence support formed by two key indicators: The 50-day Simple Moving Average (SMA) (green) at $0.00000796 and the 200-day SMA (blue) at $0.00000774. This suggests dwindling selling pressure, as the bulls are entirely taking the reigns.
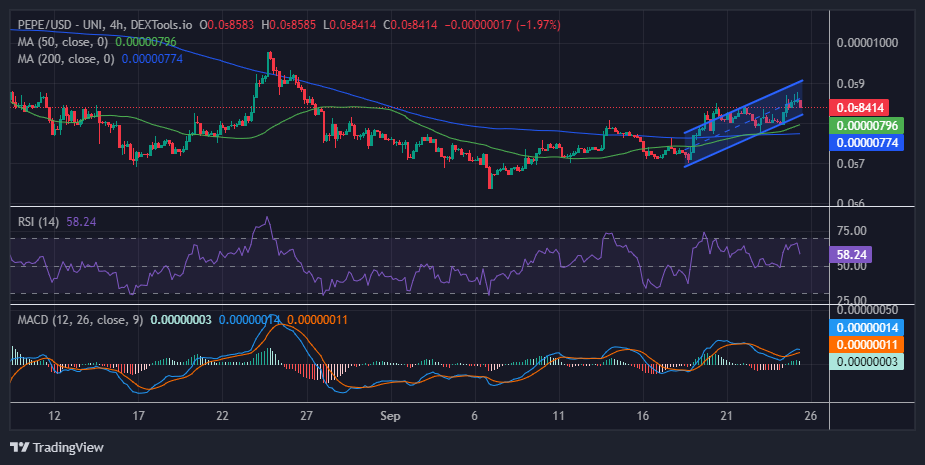
The Relative Strength Index (RSI) climbed from support at the mid-line (50) and jumped into a near-overbought area, almost hitting a 70-level strength before retreating to 58. Traders won’t have to worry about sudden pullbacks, as the bulls have slightly retraced in search of enough liquidity before a substantial leg up.
The MACD also upholds the bullish outlook while sitting above the neutral line. If the blue MACD line keeps the gap above the signal line intact, a recovery will soon resume as traders return to seek exposure to PEPE longs. As observed from the four-hour chart, the blue MACD line holds above the signal line in orange as the momentum indicator sits in the positive territory.
Will the Bulls Capitalize on the Golden Cross?
In the 4-hour chart above, the odds tilt in favor of the bulls as technical indicators uphold the bullish picture. The Pepe price could surge if the traders and investors step in at this level, capitalizing on all technical indicators, including RSI, MACD, and Moving Averages. Moreover, the bulls have reduced the sellers’ influence, leaving Pepe’s price in a resistance-free zone. In such a case, increased buying pressure will see the bulls resume a meaningful uptrend, capitalizing on the golden cross, with the Pepe price reaching $0.00001.
Conversely, if the bears step in and the whole crypto market turns negative, the Pepe price will drop. If the pepe price declines, the support provided by the 50-day SMA would be instrumental in bulls desiring to arrest the bearish situation. Otherwise, investors may have to acclimatize to losses extending to the next support at $0.00000774, coinciding with the 200-day SMA.
Advertisement


