

The Solana price has plunged 1.8% in the last 24 hours to trade at $129 as of 5:27 a.m. EST on a 135.8% surge in trading volume to 3.1 billion. The market cap is now at $60 billion. Solana’s SOL token is facing continuous bearish momentum, casting doubt on the stability of its key support level. Intense selling pressure has led to significant price declines and diminishing buyer interest, as indicated by technical analysis and on-chain metrics.
Although Solana price action remains under pressure, the network’s on-chain metrics paint a more positive picture. Data from Santiment shows that Solana has recorded the highest month-over-month increase in development activity, rising by 33.42%.
Advertisement

🧑💻 In terms of each crypto ecosystem's total development activity events, Ethereum remains on top. But Solana, Avalanche, and Cosmos are the fastest risers.
Bookmark the completely FREE @santimentfeed Development Activity Dashboard to keep tabs here: https://t.co/W7iBlWZVIu pic.twitter.com/at8Ub75rx2
— Santiment (@santimentfeed) August 29, 2024
This surge highlights the network’s ongoing growth and suggests strong long-term potential despite current price challenges. Additionally, DeFiLlama reports that Solana Total Value Locked (TVL) has grown by over $1 billion in the past month, indicating significant capital inflows even amid bearish price trends. However, these encouraging on-chain metrics have yet to translate into a price recovery, as market participants remain cautious.
Solana Statistics
- Solana price: $129
- Market Cap: $60 billion
- Trading volume: $3.1 billion
- Circulating supply: 466 million
- Total supply: 583 million
Solana Price Continues to Face Downward Pressure
The Solana price recent downward trend from the resistance level to the support level of the descending triangle has shown bear control to the market. leading to the formation of a descending triangle which indicates a further bearish trend. Despite the bulls’ attempt to cross over the upper trend line, bears continue to push the price lower to the $128 support level.
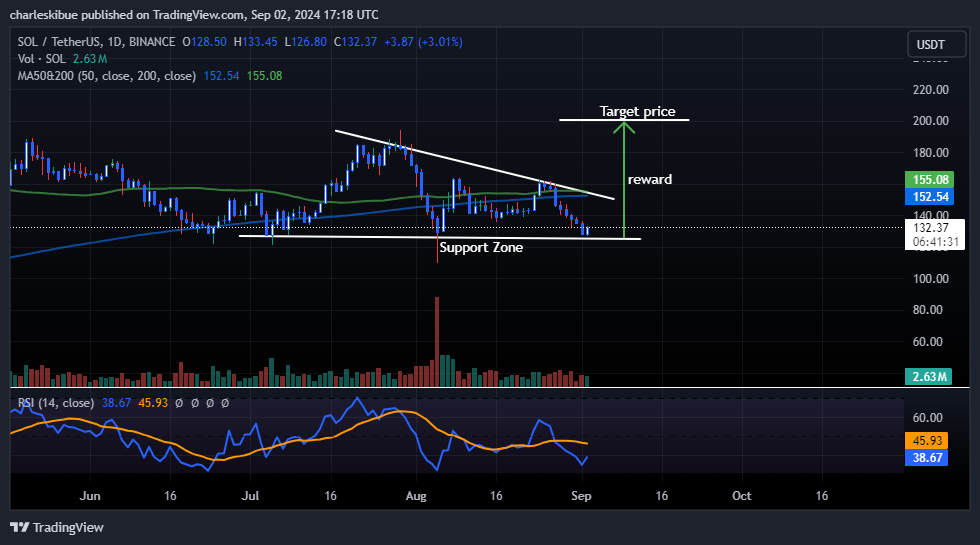
Solana price is currently trading below the 50-day and 200-day simple moving averages (SMA), which act as the key resistance level of the Solana price. Adding to the bearish outlook, Solana’s Relative Strength Index (RSI) has been trending downward, signaling that bears are firmly in control. Currently positioned at 39.13, the RSI indicates that SOL is in oversold territory. The RSI’s pattern of forming lower lows further emphasizes the sellers’ dominance in the market.
However, there’s a glimmer of optimism as the RSI has recently shown an upward shift in momentum, hinting at a potential bullish crossover in the near term. This shift, along with two consecutive green candles on the four-hour chart, suggests that SOL could experience a short-term bounce off the $132 support level.
Additionally, the moving average convergence divergence (MACD) further supports the probability of the bearish continuation. The red histogram bars are seen increasing in size and number as they also maintain their red bright color. On the other hand, the Orange signal line is seen to have already surpassed the blue line of MACD.
Solana Price Prediction
Breaking above $151.95 is crucial for Solana to signal a potential uptrend, with the next target set at $163.99. However, if these levels are not breached, Solana could remain in a consolidation phase, waiting for a clearer direction.
As Solana approaches its $132 support level, market attention turns to whether buyer interest will resurface. A strong defense of this support could trigger a short-term bullish reversal, but a breakdown could lead to further significant losses.
Advertisement


