


The PEPE price has plunged 4%, with the frog-themed token falling to $0.000007948. This comes as the whole crypto market has dipped 5% in the past 24 hours, with the pioneering crypto(BTC) down 3%. Despite the slight dip, PEPE is now up 2% in a week, although the deflationary memecoin on Ethereum remains down 32% in a month. Notably, the frog-themed memecoin is up 810% in a year, underlining its credential as one of the fastest-growing meme tokens.
Meanwhile, ZackGold, a private investor, has taken to the X platform, mentioning that the higher low is expected and that they could see a move back to the 4hr 105 EMA.
Advertisement

$PEPE #PEPE
Higher low in hopefully and could see a move back to the 4hr 105 EMA then sideways action into Sep with 9th to 16th being the time to try for a breakout of the down trend resistance pic.twitter.com/gbqNjM4KGf— ZG Charting (@ZackGold16) August 28, 2024
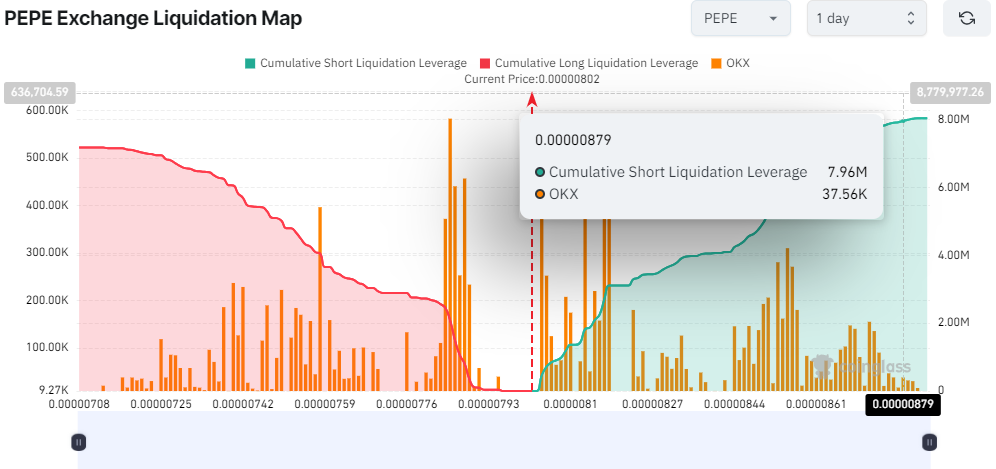
On the other hand, traders and investors have booked short positions in the PEPE market, suggesting bearish prospects. According to data from Coinglass, the short positions are comparably higher than the long positions. This raises questions about PEPE’s future outlook, as traders’ confidence seems to be staggering.
Pepe Statistical Data
Based on CoinmarketCap data:
- PEPE price now – $0.000007948
- PEPE market cap – $831.76 million
- PEPE total supply –420.69 trillion
- PEPE circulating supply – 420.69 trillion
- PEPE ranking – #25
The PEPE price trades within the confines of a falling wedge, technically suggesting a bullish reversal. The frog-themed memecoin in mid-July faced the upper limit/resistance at $0.00001303, forcing the price to tumble, with the bulls establishing strong support at $0.000007315. A critical support zone around the $0.0000007315 level holding firm indicates intense buying interest at this level and prevents further downside.
Bulls Aim for a Breakout Above the Falling Wedge Pattern
In the daily chart frame, the bulls are attempting a recovery, as a decisive green candlestick upholds above the pattern’s lower trendline. Diving into the technical outlook, it paints a bearish picture. The PEPE price trades below the 50-day and 200-day Simple Moving Averages (SMAs). In this scenario, the $0.00000872 and $0.00000952 act as immediate resistance keys, suppressing the bulls against upward movement.
Moreover, the Relative Strength Index (RSI) currently sits at 44, slightly below the 50-mean level. Its position below 70 indicates that there remains significant room for the upside before PEPE is considered overbought.
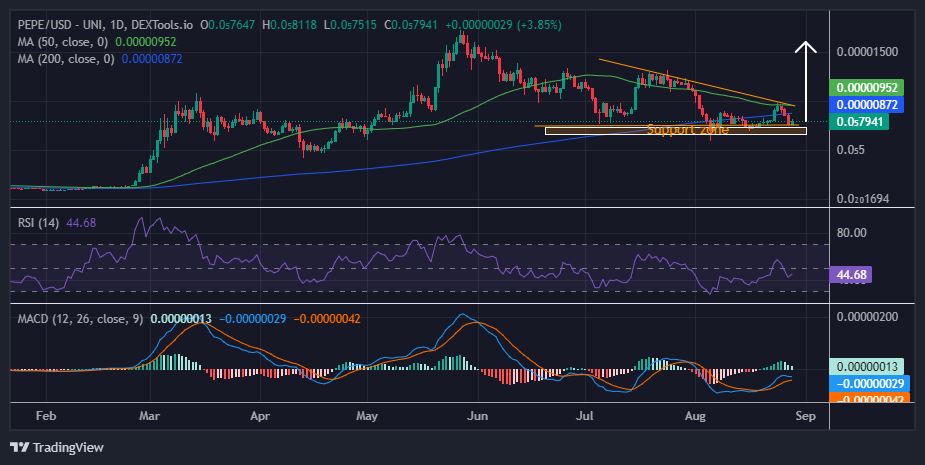
On the other hand, the Moving Average Convergence Divergence (MACD) calls for traders to rally behind PEPE. This is evident as the blue MACD indicator has flipped above the orange signal line, suggesting a bullish sentiment in the market. Furthermore, traders should consider rallying behind PEPE unless the MACD changes.
Will the Bulls Gain Momentum?
The 1-day chart above suggests a cautiously optimistic outlook. A confirmed breakout above the wedge pattern and Moving Averages, accompanied by bullish signals from the RSI, is necessary for confirmation.
A breakout above the governing pattern is possible if the price remains above the support zone at $0.0000007710 and shows signs of strengthening. A move above the 50-day SMA at $0.000000952 could trigger further bullish momentum toward the target price of around $0.000015, representing a significant upward move.
On the flip side, a break and breach below the $0.0000077 support could lead to further declines in the PEPE market. If the price fails to hold this support, it could lead to further downside, potentially resetting lower levels at $0.000004661.
Advertisement


