

Shiba Inu price, a popular meme coin, has seen a dip in recent days. The token’s value has dropped below $0.000014 as the market bears gain control. This downward trend in Shiba Inu aligns with a broader decline observed across the meme coin market and the cryptocurrency sector as a whole. The recent price movement reflects the overall market sentiment, where several digital assets have faced pressure, contributing to the dip in Shiba Inu’s value.
What’s Next for Shiba Inu Price Amidst Market Bearish Trends?
Over the past 24 hours, Shiba Inu (SHIB) has experienced a bearish trend, with its price indicating a decrease of 1.85%. The meme coin has been hovering between a high of $0.00001483 and a low of $0.00001426. At the time of writing, the SHIB price stood at $0.00001434, marking a decline during the U.S. trading session.
Advertisement

Over the past week, Shiba Inu prices have surged by 5% after a market recovery. The 24-hour trading volume is $235.93 million, indicating an 8.00% increase in trading activity. However, despite the current dip in market cap by 2.13%, resulting in a valuation of $8.44 billion.
Shibarium is experiencing a significant downturn as its transaction volumes sharply decline. Recent data from Shibariumscan reveals that daily transactions on August 27 plummeted to 4,002, a drastic drop from the 28,600 recorded on August 20. This steep decline has raised concerns about Shibarium’s future amid a crowded layer-2 solutions market.
SHIB Token Burn Rate Plummets
Additionally, the SHIB token burn rate has plunged alarmingly. According to the Shibburn wallet tracker, the burn rate is nearly 100% below zero, with only 261,691 SHIB tokens burned recently. This contrasts sharply with the seven million SHIB tokens burned just a day earlier. The declining metrics are sparking debate on Shibarium’s long-term viability as the competition in the layer-2 space intensifies.
Shiba Inu continues its downward trajectory as social volume remains subdued. The cryptocurrency’s price has experienced a steady decline over the past few months, reflecting waning investor interest. Data from Santiment highlights a significant drop in social engagement, which has failed to provide the necessary momentum to reverse the bearish trend.
Is There Hope for a Bullish Reversal?
The meme coin Shiba Inu is currently at a pivotal support level. If this support fails, SHIB’s price could dip below $0.000014. If this happens, the next potential support zone is around $0.000013. Further declines could push the price to $0.00001, indicating a market dominated by sellers.
Conversely, Shiba Inu might rise above the $0.000015 mark if bullish sentiment returns. A breakthrough at this level could lead to an ascent toward $0.00002. With sustained bullish momentum, surpassing $0.000025 could alter its usual trading patterns, reaching a potential peak at $0.00003.
The MACD (Moving Average Convergence Divergence) shows a slightly bearish crossover, with the MACD line (blue) below the signal line (orange). The histogram also suggests a minor bearish momentum, possibly continuing the downward trend.
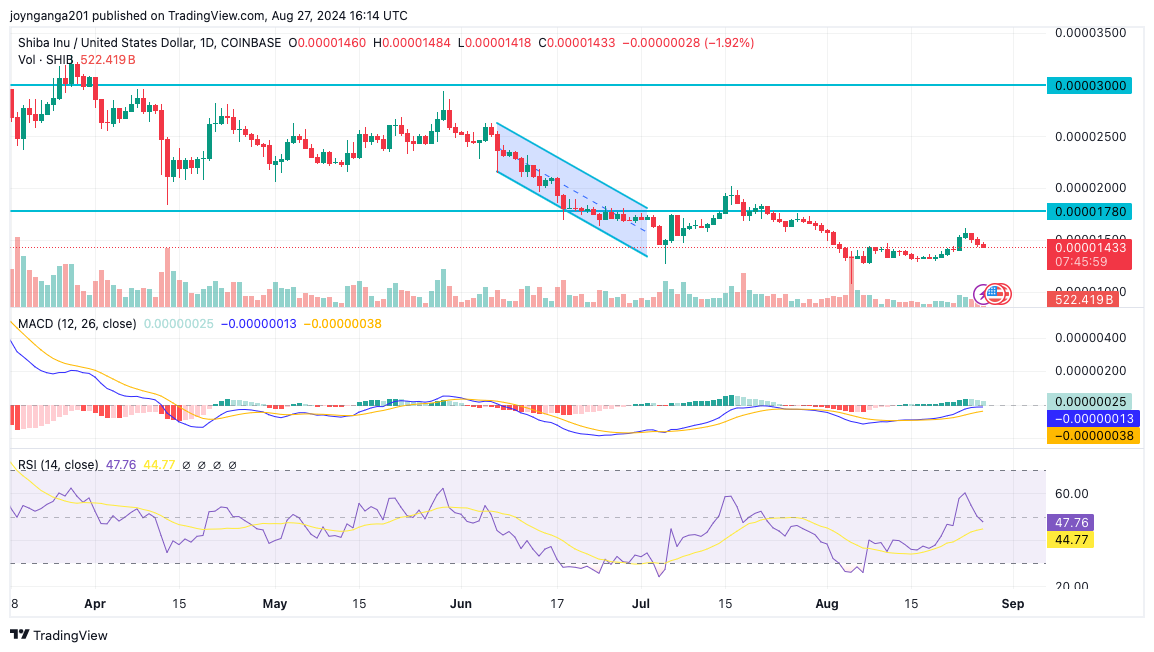
The RSI (Relative Strength Index) is currently at 47, just below the neutral 50 level, indicating a slight bearish sentiment but not yet in oversold territory. This suggests that while SHIB might face further declines, there could still be potential for a reversal if buying pressure increases.
Advertisement


