


Over the last 24 hours, the price of Toncoin has dropped by 3.5%, now trading at $5.42. The trading volume decreased by 18.7% to $1.2 billion simultaneously. With a market cap of $13.7 billion, Toncoin has surged 269% this year alone, securing a spot among the top 10 cryptocurrencies by market cap.
The Toncoin price suffered a significant drop on August 24 following the arrest of Telegram creator Pavel Durov at a French airport. This decline has pushed Toncoin out of the top 10 rankings, with it now competing for the 11th spot, while Cardano, aiming for $1, is close behind.
Advertisement

After the latest news about the founder of Telegram, TONCOIN faced a sharp 20% drop in its price. The price is currently hovering at $5.86, and the recent decline raises concerns among traders and investors.
Here's my technical analysis of TONCOIN on a daily timeframe.
TON has… pic.twitter.com/CCMrHRncuN
— Cryptorphic (@Cryptorphic1) August 25, 2024
Interestingly, TON whales have been accumulating large amounts of the asset, possibly in anticipation of PavePavel’sease, which could be a significant catalyst for a TON price rebound. According to data from Santiment, whales took advantage of the TON price dip, buying a significant amount at the bottom during the crash.
The blue line indicates that whales purchased between $3.29 million and $3.48 million worth of TON, while the yellow line shows a consistent accumulation from August 20 to August 25. During this period, these whales sold between $4.07 million and $3.98 million worth of assets. This activity suggests that the whales may have inside information, possibly explaining their strategic accumulation of TON.
On August 26, the number of daily active addresses (DAA) on TON shot up, along with the transaction count. This surge in activity among investors is a positive sign for ToncToncoin’sce. High network activity often means increased volatility, which could lead to significant price movements, especially if the market starts to recover.
Toncoin Statistics
- Toncoin price: $5.42
- Market cap: 13.7 Billion
- Trading volume: $1.2 Billion
- Circulating supply: 2.5 Billion
- Total supply: 5.1 Billion
Toncoin Price Rebounds Within the Bearish Channel
The chart analysis for the TON/USDT trading pair on a 4-hour timeframe reveals a potential shift in momentum. The price has been moving within a sharp, bearish channel, marked by lower highs and lower lows, indicating a sustained downtrend. However, recent price action shows a breakout from this bearish channel, suggesting that the downward pressure may weaken.
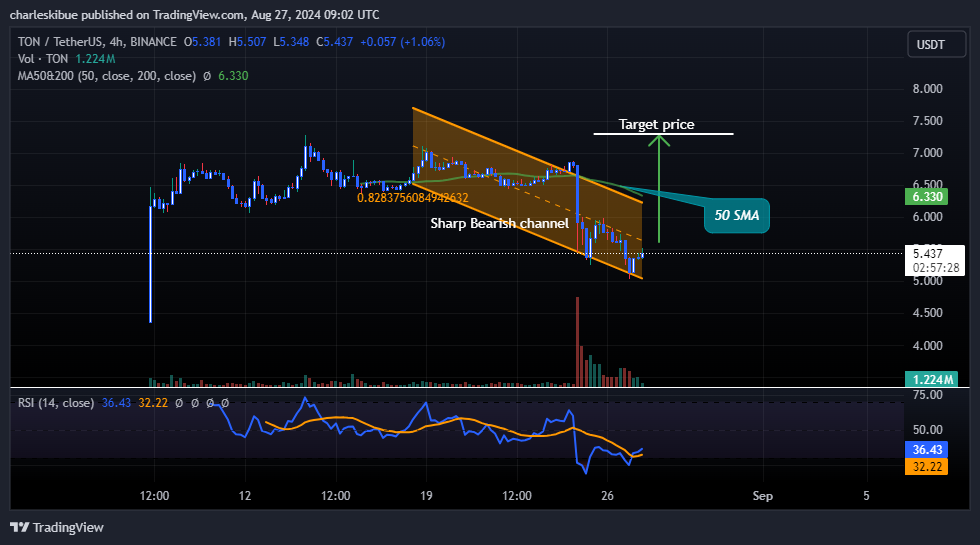
The 50-period Simple Moving Average (SMA) is currently above the price, acting as a dynamic resistance level. The target price is around 50 SMA at $6.33, implying that the price might aim to reach or test this level in the near term. The Relative Strength Index (RSI) stands at 36.65, indicating that the asset is approaching oversold conditions. The RSI recently hit a low of 32.23 and has begun to climb, hinting at a potential recovery in price.
Volume, recorded at 1.226M, suggests active trading and could signify that market participants are responding to the breakout from the bearish channel. The breakout and the RSI nearing oversold levels point towards a likely short-term upward movement, with the 50 SMA as a critical resistance level. If the price breaks above this SMA, it could confirm a trend reversal, leading to further gains for the Toncoin price.
However, failure to breach the 50 SMA might result in a consolidation or a return to the previous bearish trend. Traders should watch this level closely for potential buying opportunities or signs of continued downward pressure.
The Final Thought
If the price continues its upward momentum and breaks above the 50 SMA in the coming days, it could rally towards higher levels, potentially targeting the next resistance around $7.00. On the other hand, if the price fails to clear the 50 SMA, it may indicate that bearish forces remain dominant, possibly leading to a retracement towards the $5.00 support level. Traders should stay alert for either a confirmation of the trend reversal or indications of ongoing bearish pressure.
Advertisement


