


The Pepe price surged 1.8% in the last 24 hours to trade at $0.000009091 as of 7 a.m. EST, despite a 28% drop in trading volume to $654 million. The market cap currently stands at $3.8 billion. The Pepe price has risen significantly over the past week, and the asset is nearing the conclusion of a potential breakout pattern.
Various market factors will influence the outcome of this breakout. Whales seem to stay out of the market while traders prepare to push prices higher. PEPE encountered resistance at a barrier on the daily chart, and traders are responding to this lag in price movement.
Advertisement

$PEPE 👋 (daily) #pepe made a nice comeback 📈 after getting bottomed out from the Symmetrical triangle in the daily timeframe🟢.
We can get a Humongous 🚀 Breakout, if we get a breakout from this symmetrical triangle❗️.
Currently the price moving towards the breakout👀,… pic.twitter.com/lqwcln0lUY
— The Crypto Titan's (@cryptotitans11) August 26, 2024
Data from Santiment reveals that PEPE’s social volume has surged to a monthly high. This indicates a spike in mentions of ‘pepe’-related keywords on platforms like X and Telegram over the past 24 hours.
The combination of a 7-day price increase for PEPE and the heightened social volume suggests that investors are actively seeking information about PEPE before making investment decisions. Despite the increased social buzz, futures traders are closing their long positions.
According to Coinglass data, while longs still outnumber shorts, traders are closing their positions at a loss. This behavior often leads to an increase in short positions, which could signal a bearish trend for PEPE’s price.
PEPE Statistics
- Pepe price: $0.000009091
- Market Cap: $3.8 Billion
- Trading volume: $866 million
- Circulating supply: 420 trillion
- Total supply: 420 trillion
PEPE Price Bulls Face Resistance on the Upper Trendline of the Wedge
The PEPE price trading pair on a daily timeframe displays a falling wedge pattern, which is generally considered a bullish reversal pattern.
The wedge is characterized by a downward trend with converging trend lines, indicating that the price is narrowing as it moves downward. This pattern often signals a potential upward breakout, particularly if the price breaks above the upper trend line of the wedge.
Currently, the price is just below the upper trend line of the falling wedge, suggesting that it is nearing a critical point where a breakout could occur. A successful breakout above this upper trend line would likely signal a bullish reversal and could lead to a significant upward move toward the target price indicated on the chart.
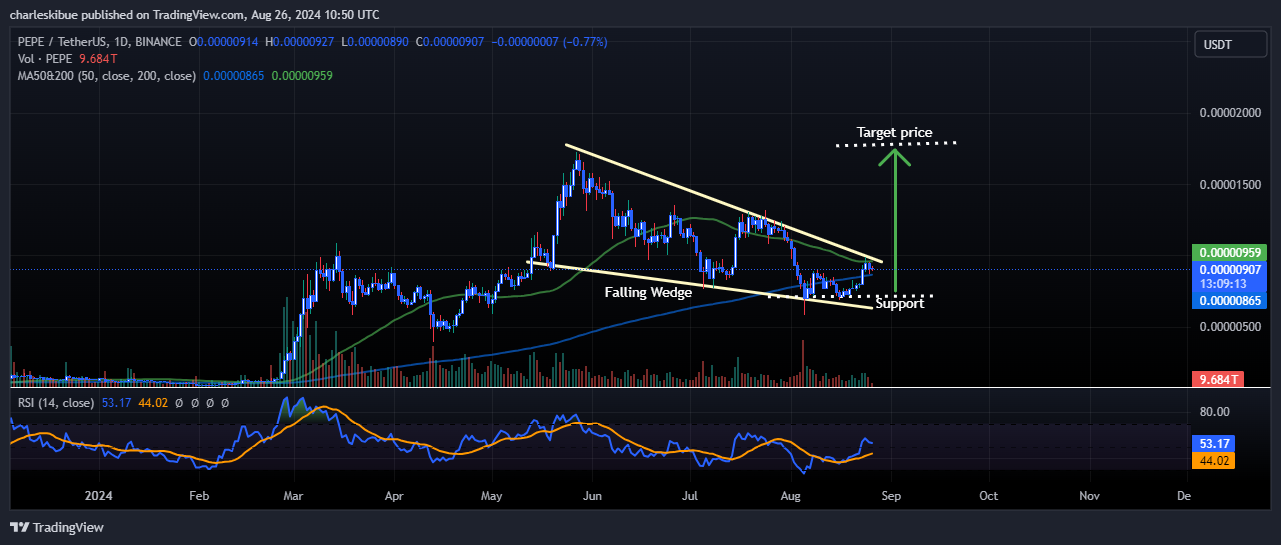
The price also trading near the 200-day simple moving average (green line), a significant long-term resistance level. A break above this level would reinforce the bullish reversal signal and attract additional buying interest.
More Uptrend on Bullish Technicals
The price is just below this key long-term moving average. If the price can break and sustain above this level, it could indicate a shift from a bearish to a bullish trend.
The 50-day SMA is also nearby, and a crossover above the 200-day MA (which is currently happening) would form a bullish “golden cross,” a strong bullish indicator that often precedes a significant price increase.
The Relative Strength Index (RSI) is currently at 53.07, which is in the neutral zone. This suggests that the asset is not overbought or oversold, leaving room for upward movement if buying pressure increases for the pepe price. The RSI is slightly above 50, indicating a slight bullish bias.
Additionally, the MACD line is slightly above the signal line, and both are positioned in the lower part of the chart, indicating that bearish momentum is weakening. If the MACD line continues to rise above the signal line, it could signal a shift toward bullish momentum, supporting a potential upward breakout.
Pepe Price Prediction
The PEPE/USDT is at a critical juncture within a falling wedge pattern, which typically signals a bullish reversal. A breakout above the upper trend line of the wedge, especially with accompanying volume, could lead to a significant upward move toward the target price.
The price’s proximity to the 200-day and 50-day moving averages suggests that the market is at a pivotal point where a break above these levels could confirm a trend reversal.
However, traders should also be cautious of a potential failure to break out, which could result in continued consolidation or a further decline. The RSI and MACD both suggest that momentum is shifting in favor of the bulls, but confirmation through price action and volume will be key.
Advertisement


