


The Pepe price has surged 2.8% in the last 24 hours to trade at $0.000008152 as of 5 a.m. EST on an 11% drop in trading volume to $654 million. The market cap currently stands at $3.4 billion.
The Pepe price has risen significantly over the past week, and the asset is nearing the conclusion of a potential breakout pattern. Various market factors will influence the outcome of this breakout. Whales seem to stay out of the market while traders are getting ready to push prices higher.
Advertisement

$PEPE surges 13% in 24 hours: Is the memecoin turning bullish again?
PEPE’s price chart is intriguing, indeed. Since late July, the token has been on a downtrend, with lower lows being formed over time coupled with lower highs.
Nevertheless, recent price surges broke this… pic.twitter.com/O8bsyHhfso
— Vlad Hryniv (@hryniv_vlad) August 22, 2024
According to Santiment, PEPE’s daily transaction volume ratio of profits to losses has surged to 3.10, marking its highest month-on-month level this year. This indicates that for every PEPE transaction resulting in a loss today, 3.10 transactions have generated a profit, suggesting that PEPE traders are seeing more gains than losses.
Moreover, while the total amount of PEPE tokens in profit has risen, 31.85% of PEPE holders are still “out of the money,” as reported by IntoTheBlock. This means that these holders’ current price is below the average entry price.
PEPE Statistics
- Pepe price: $0.000008152
- Market Cap: $3.4 Billion
- Trading volume: $734 million
- Circulating supply: 420 trillion
- Total supply: 420 trillion
PEPE Bulls Break Out Within the Falling Wedge
The Pepe price moves within a falling wedge generally considered a bullish reversal pattern. The wedge is characterized by a downward trend with converging trend lines. A breakout above the upper trend line of the wedge could signal a potential upward move.
While the price has been trending downward, there’s a growing possibility of a reversal to the upside. As the wedge’s upper and lower trendlines converge, the price is nearing a critical point where it could break out above the wedge, signaling a potential shift from a bearish to a bullish trend.
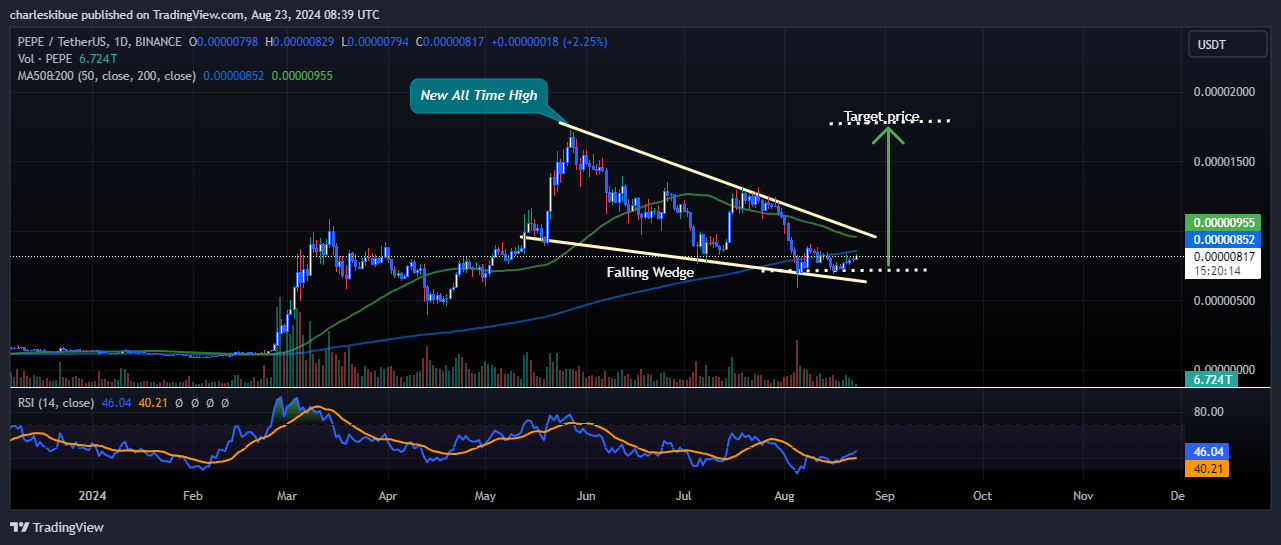
The price hovers just below the 200-day moving average (blue line), a significant long-term support and resistance level. Breaking above this level could indicate a shift in the trend from bearish to bullish. The 50-day moving average (green line) is below the 200-day MA, indicating that the asset has been in a bearish phase. However, the proximity of the price to the 50-day MA suggests that a breakout could lead to a bullish crossover, which is typically a positive signal.
The RSI is at 46.04, still in the neutral zone but leaning towards the lower end. This indicates that the asset is neither overbought nor oversold, leaving room for potential upward movement if buying pressure for the Pepe price increases.
The MACD line (blue) is just below the signal line (orange) in negative territory, indicating slight bearish momentum. However, the lines are close to converging, which could signal weakening bearish momentum and a possible bullish crossover if the price increases.
More Upside Coming
There is a moderate level of volume, which supports the price movement. A spike in volume during a breakout would add more confidence to the potential bullish move. The target price indicated on the chart is around $0.00001608. If the price breaks out of the falling wedge and surpasses the moving averages, this could be a potential target for the next upward move.
Advertisement


