


The Pepe price has plunged 11% in the last 24 hours to trade at $0.000007503 as of 5:19 a.m. EST, on a 35% surge in trading volume to $894 million.
Pepe price has also been down for the week due to ongoing bearish pressure, and technical indicators suggest a further decline. Its strong correlation with Ethereum might influence its drop, as the ETH ETF experienced negative net flows, leading to a 2.9% price decrease on August 15.
Advertisement

$PEPE looking promising!
After a long consolidation, a bullish breakout is imminent. 👀
If it breaks the resistance at 0.0000075, we could see a significant price increase. pic.twitter.com/iTDkD9LVZv
— BIT CO.🦊 (@BIT_CO_) August 16, 2024
Despite a positive sign of reduced exchange reserves (1.44 trillion tokens), the PEPE price still fell, likely because investors may be moving tokens to other exchanges or decentralized platforms for arbitrage.
Additionally, Coinglass data shows declining open interest (OI) and Cumulative Volume Delta (CVD), indicating traders are closing long positions, possibly resulting in losses due to the negative funding rate.
Pepe Price Statistics
- Pepe price:$0.000007503
- Market cap:$3.1 billion
- Trading volume: $894 million
- Circulating supply: 420 trillion
- Total supply: 420 trillion
Pepe Bulls TaKe More Downward Pressure
The price is still on a consistent downturn due to the bearish pressure, even as bulls attempt to push it higher from the $0.000007015 support level. The bulls are regrouping in this support zone, indicating that the price might explode soon due to the bullish trend. If the bulls can sustain their momentum, it could signal a broader market shift towards bullish sentiment. Traders will watch closely for confirmation of this trend change through higher highs and continued upward movement.
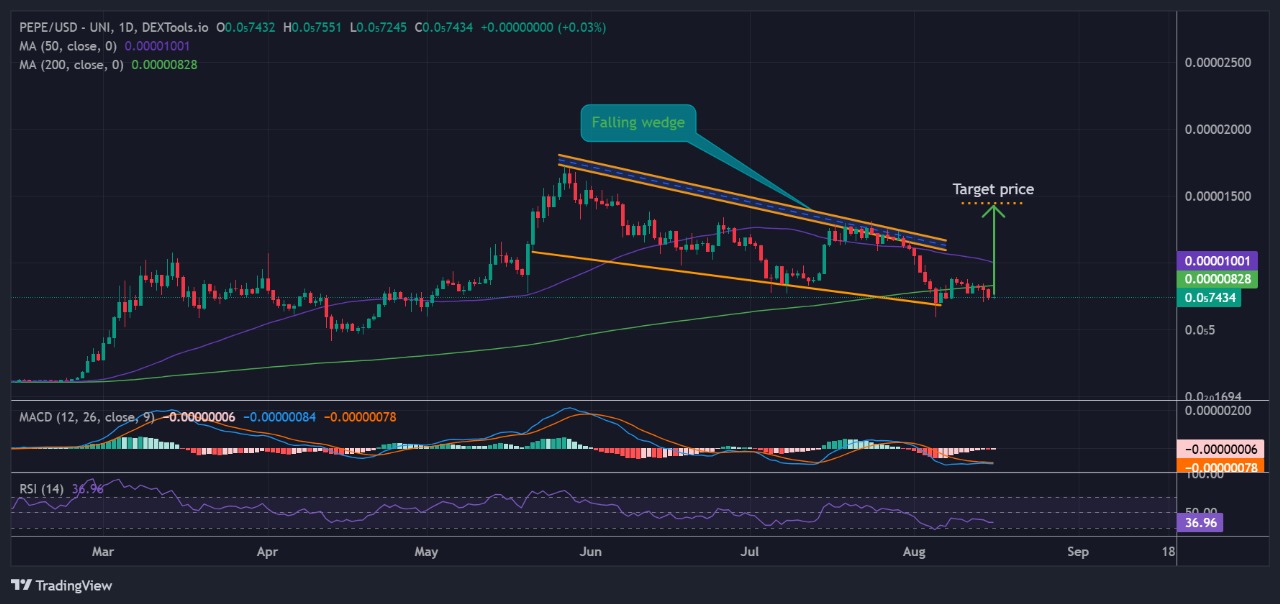
Pepe’s price is currently trading below the 50-day and 200-day simple moving averages (SMAs). However, the price is approaching the 50-day SMA and looks set to break through it. If successful, it could turn the 50 SMA into a strong support level and signal a bullish rally. Increased momentum might lead to a push above the 200-day SMA, making both SMAs significant support points and allowing a bull rally.
The Relative Strength Index (RSI) is potentially bullish as it climbs towards the 50 midline level, indicating intense buying pressure. Crossing above this midline would indicate a shift from bearish to bullish momentum, suggesting that average gains are starting to outpace average losses. If the bulls continue their push, the RSI could climb to the 70 overbought zone.
Additionally, the Moving Average Convergence Divergence (MACD) is rising and moving towards crossing above the signal line (orange), though still below the neutral level. Meanwhile, the red histogram bars are decreasing in size, further reinforcing the possibility of an impending bull rally.
Pepe Price Prediction
The bulls are positioned to recover their losses as they have hit the lower trendline of the bearish channel. This means that the bulls can drive the price back up again with the help of the support zone and the technical indicators. In this scenario, the bulls could fly the price to $0.00002114. Conversely, if the bears regain control, they could exert pressure on the bulls, potentially driving the price below the $0.000007015 support level and the lower trendline of the bearish channel pattern.
Advertisement


