
The Apecoin (APE) price is in focus today, as the token is down almost 1%, with the APE/USD trading at $0.599. Despite the slight plunge, the APE price is up 6% in a week. Its 24-hour trading volume has surged 1% to $31 million. However, the token’s price is down 17% in a month and 69% in a year, suggesting a lack of confidence among traders and investors.
Meanwhile, all hope is not lost as the team has revealed its participation in the WebX-Asia set to take place in Japan. The team has mentioned that “ApeCoin will be featured across the main stages, including an interactive booth co-hosted with Arbitrum.”
Advertisement

ApeCoin is coming to Japan @WebX_Asia, August 28-29th!
ApeCoin will be featured across the main stages, including an interactive booth co-hosted with @arbitrum, chances to win ApeKin plushies, refreshments, and special perks!
Thread below, stay tuned for more WebX2024 updates🦍 pic.twitter.com/HrEWRljtwW
— ApeCoin (@apecoin) August 12, 2024
On the other hand, the Apecoin price shows signs of recovery after a prolonged downtrend, establishing strong support at $0.55.
APE Statistical Data
Based on CoinmarketCap data:
- APE price now – $0.599
- APE market cap – $362 million
- APE total supply – 1 billion
- APE circulating supply – 604 million
- APE ranking – #137
ApeCoin Price Aims for a Breakout Above the Falling Wedge Pattern
The Apecoin price is trading bearishly as the sellers appear to have the upper hand. The price of APE has been on a prolonged downward trend, trading within the confines of a falling wedge. It has dropped from the $1.35 resistance to the $0.55 support. The technical outlook also flashes bearish as it trades below the 50-day and 200-day Simple Moving Averages(SMAs). In this case, the $0.7612 and $1.3248 act as immediate resistance keys for the bulls before a potential upward trajectory.
Notably, the Relative Strength Index(RSI) roams around the 30-oversold zone, currently at 38. This suggests that the token is oversold. However, the bulls might initiate a buy-back campaign, which may trigger an uptrend. In such a case, increased buying pressure could cause the RSI to hurtle above the 50-mean level to the 70-overbought zone.
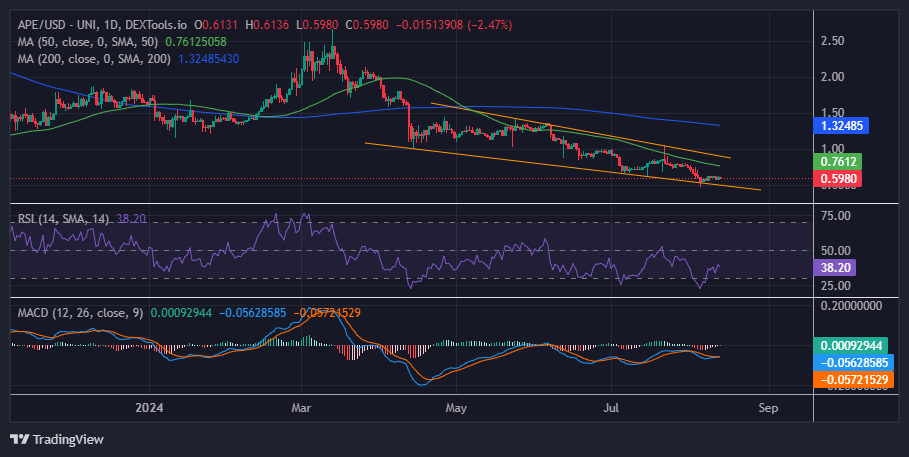
The MACD indicator has flipped above the signal line in the daily chart timeframe, shifting the momentum from bearish to bullish. The MACD indicator in blue upholds the bullish picture, with a buy signal, calling to traders to consider buying Apecoin. As the momentum indicator gradually ascends towards the mean line (0.00) into the positive region, the path with the least resistance stays on the upside.
Will the Bulls Initiate a Bullish Reversal Rally?
According to the technical outlook in the daily chart timeframe, the sellers seem exhausted. This may enable the bulls to enter the market, triggering an upward movement. If the buyers capitalize on the oversold RSI and the buy signal initiated by the MACD indicator, they might trigger a bullish reversal rally. In such a case, the bulls must first flip the primary resistance keys at $0.76 and $1.32 into support, potentially triggering a rally. This might see the bulls eye the next resistance at $2.09.
Conversely, if the bears capitalize on the 50-day and 200-day SMAs, which suggest bearish prospects, the price of Apecoin may drop. The APE price would retest the $0.55 support in such a scenario. A breach below the $0.55 support level will cause the price to plunge to $0.41.
Advertisement