


The Pepe price has surged 33% over the past week and 25% in the last 24 hours to trade at $0.00001219 as of 10:47 p.m. EST, on a t93% trading volume to $2.08 billion.
The market cap is currently at $5.1 billion. Nevertheless, some sceptics question Pepe’s potential for further growth, suggesting its recent rally is merely reflective of the broader uptrend in the crypto market. Despite these doubts, Pepe has outpaced other meme coins, recording the highest growth among the top 10 last week, with DOGE up 3.8% and both SHIB and WIF rising approximately 2.8%.
Advertisement

Pepe has a strong memetic presence, being a major figure in meme culture since its inception. This makes it easy to integrate Pepe into the narrative of current events. Recently, one of Pepe’s memes went viral on X (Twitter), showing Pepe in a pose similar to that of former President Donald Trump in a recent photo.
$PEPE pic.twitter.com/n1LZ2vruko
— JIMMY 🐸 (@JimmyTheMemer) July 14, 2024
Pepe’s strong presence in meme culture is crucial for its growth, but it’s not the sole reason for its recent surge. Influencer Plazma, who has over 18,000 followers on X (Twitter), predicted today’s pump and remains bullish on Pepe, even suggesting it could surpass Dogecoin. However, Pepe’s growth is still uncertain due to the many factors at play.
The $PEPE has been showing a lot of strength lately. It's coiling up for a pump. pic.twitter.com/79whVg0h3a
— Plazma (@Plazma0x) July 14, 2024
Pepe Price Statistics
- Pepe price: $0.00001219
- Market cap: $5.1 billion
- Trading volume: $2.08 billion
- Circulating supply: 420 trillion
- Total supply: 420 trillion
Pepe Price on the Brink of a Bully Rally Ahead
Pepe’s price has been on a steady upward trend, with bullish investors driving it up from the $0.000008378 support zone. This upward momentum has enabled the market to break out of the falling wedge pattern, specifically surpassing the upper trend line. The bulls have shown significant strength and determination, pushing the price up to a key resistance level at $0.00001268. This indicates strong buying interest and suggests that the bullish momentum could continue if the current sentiment persists.
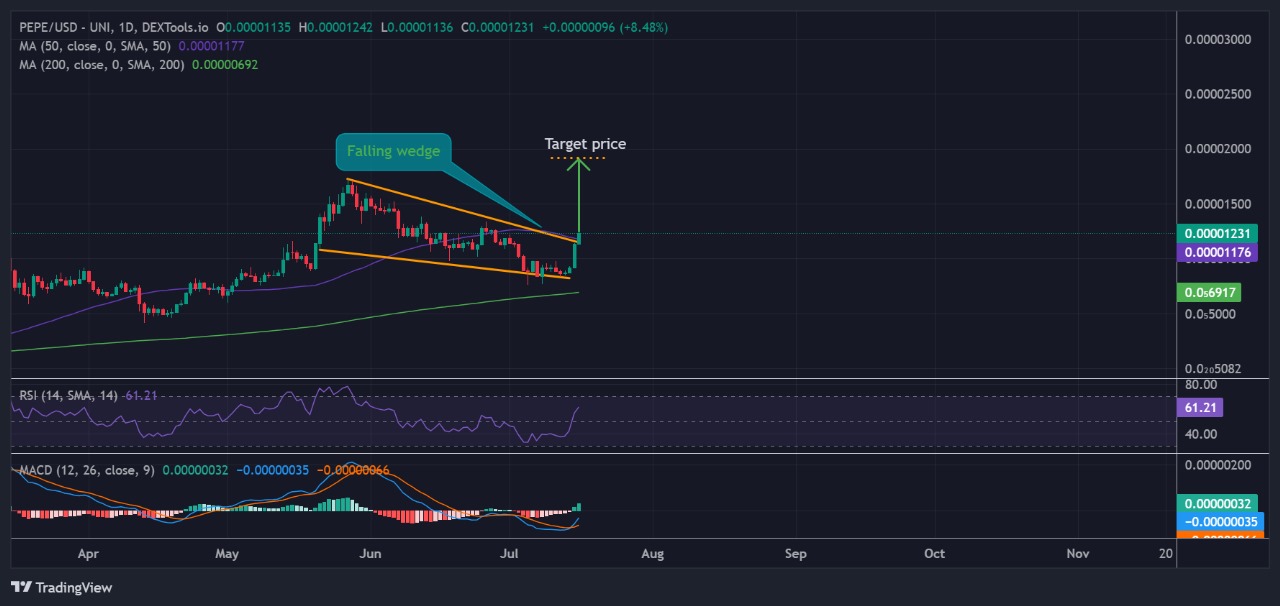
PEPEUSDT Analysis (Source: Dextools.io)
Currently, the market is trading above both the 50-day and 200-day SMAs on the daily chart. These moving averages act as key support levels and signal the potential for a bullish trend. If the bulls keep pushing the price higher and maintain it above these SMAs, they could drive the market to a new all-time high.
The Relative Strength Index (RSI) also supports the bullish rally. It’s currently above the 50-mid line level and heading towards the 70-overbought level, indicating that a bullish crossover is on the horizon.
Additionally, the Moving Average Convergence Divergence (MACD) is showing bullish signs as it nears the neutral line. The blue signal line has crossed above the orange signal line and is continuing to rise, indicating potential bullish momentum. The increasing size of the green histograms in the MACD further supports the likelihood of a bullish rally.
Will the Pepe Price Continue to Rise?
The bulls are demonstrating their strength by pushing the price higher, preventing the bears from dragging it down to the support level. If the bulls can maintain this momentum, the market could reach a target price of $0.00001919.
However, if the bears regain control at the pennant upper trendline, they could apply pressure, forcing the bulls to retreat to the $0.000004755 support zone coinciding with the lower trendline of the pennant
Advertisement


