

The Solana price has slumped by 7% in the last 24 hours to trade at $135, despite a 57% surge in trading volume to $6.1 billion. This drop comes following the release of a new video promoting XP, a decentralized alternative to Ticketmaster, by Solana on July 3rd. The video highlights the issues in the U.S. ticket industry and showcases how XP, powered by Solana, can address the challenges posed by Ticketmaster.
Solana promotes decentralized TicketMaster alternative XP in twitter video
Advertisement
Solana just dropped a new video to promote XP, a decentralized alternative to TicketMaster. The release focuses on the problems with the US ticket industry and how XP solves this so-called ‘Ticketmaster… pic.twitter.com/7Bc48IoiNF
— EchoeWeb (@Echoeweb) July 3, 2024

Solana promotes XP as a solution to the U.S. ticket industry’s problems. The company encourages users to switch to the XP platform for an improved ticketing experience. Solana says the ticket industry lacks transparency, leading to exorbitant prices. For example, a ticket priced at $455 can balloon to $1,088 due to hidden charges.
Solana Price Statistics
- Solana Price: $134
- Market Cap: $62 billion
- Trading Volume: $6.1 billion
- Circulating supply: 462 million
- Total Supply: 579 million
Solana Price Forms Strong Bullish Support
Solana’s price experienced a sharp decline, highlighting its strong bearish momentum. It initially fell to a critical support level of around $157. However, it has since broken below this support, dropping further to $138, hitting the lower boundary of the consolidation zone and forming a triple bottom pattern, which traders often see as a bullish reversal signal.
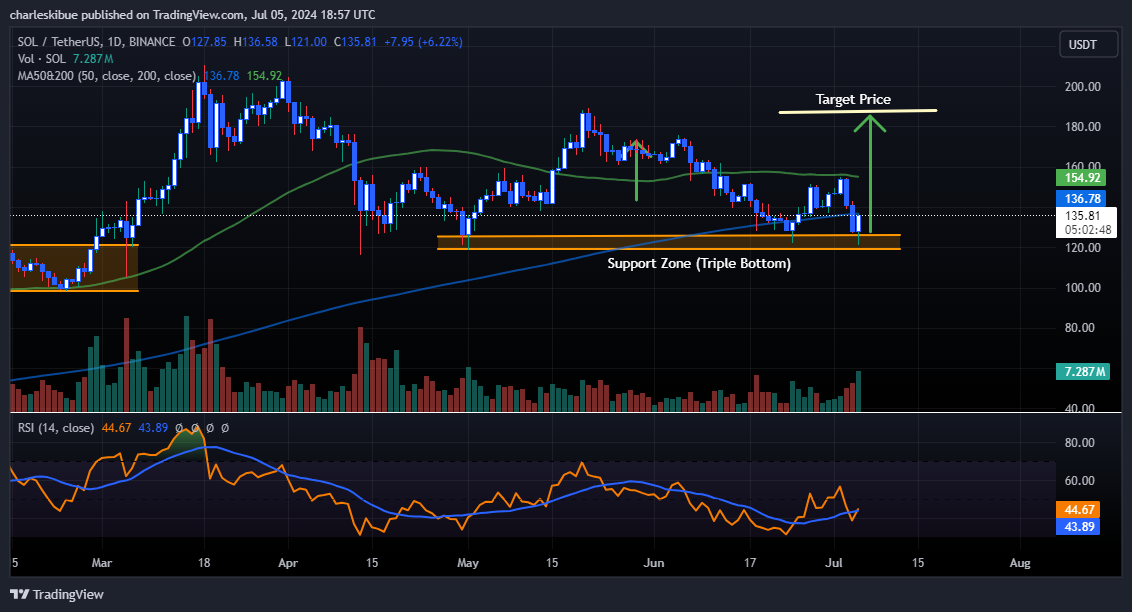
Solana’s price has dropped below the 50-day Simple Moving Average (SMA), with the 50 SMA now serving as a significant resistance level. This indicates a shift in momentum favoring the downside. However, if the broader market sentiment turns bullish in response to the double-bottom pattern, bulls could push the price back above both SMAs, potentially igniting a strong rally.
The Relative Strength Index (RSI) also shows a downtrend, currently around 44, below the neutral level of 50. This suggests that selling pressure might be easing. If bullish momentum picks up, the RSI could rise and possibly enter the overbought territory above 70, indicating increased buying interest and supporting a bullish scenario for Solana.
Meanwhile, the Moving Average Convergence Divergence (MACD) indicator signals a bearish trend. The blue average line recently crossed below the orange signal line around the neutral level, indicating bearish momentum. Additionally, the histogram bars reflect negative price movement, reinforcing the bearish outlook.
Can The Bulls Initiate a Rally?
Solana’s price has dropped from the $175 consolidation level and is currently trading below the 50-day Simple Moving Average (SMA); an upward trend is still possible. Bullish momentum in SOL’s price could potentially drive it back to around $205 in the coming weeks.
However, if bears continue to dominate below the 50 SMA, the bullish momentum might weaken, causing the price to retreat toward the $126 support level. Solana seems poised for a comeback, as market dynamics could shift if it breaks through crucial resistance levels.
Final Thought
Solana is an open-source Layer 1 blockchain that enables users to conduct transactions and deploy decentralized applications without needing permission from centralized authorities. Often positioned as a competitor to Ethereum, Solana aims to offer a smart contract platform but with significantly faster transaction speeds and lower fees. Known for its high performance, Solana has demonstrated capabilities of handling over 1,500 transactions per second at costs of less than a cent per transaction.
Advertisement


