


The Ethereum price is showing resilience, as it retested the $3,288 support level on Monday and is now near the $3,500 mark. The ETH price has surged 1%, currently trading at $3,429, as recent movements and technical indicators signal a potential rally. This comes as the launch of Ethereum ETFs is expected from any time now.
According to Web3 Market Insight, Standard Chartered predicts that the approval of spot Ethereum ETFs could bring up to $45 billion in inflows within the first 12 months. Moreover, this could potentially drive ETH’s price to $8,000 by the end of this year.
Advertisement

$ETH Standard Chartered predict that the approval of spot Ethereum ETFs could bring up to $45 billion in inflows within the first 12 months, potentially driving ETH’s price to $8,000 by the end of 2024 👀🚨
— WEB3 Market Insight 🇦🇺 (@iftikharpost) June 27, 2024
On the other hand, industry executives have told Reuters that the SEC could approve Ethereum ETF as soon as July 4.
BIG BREAKING 🚨
The SEC could approve Ethereum ( $ETH ) ETF as soon as July 4, per Reuters. pic.twitter.com/YyOVaXluqS
— BITCOINLFG® (@bitcoinlfgo) June 26, 2024
With the long-awaited ETH ETF launch, the question remains whether it will kickstart the next leg of the bull market.
Ethereum Statistical Data
Based on Coinmarketcap data:
- ETH price now – $3,429
- ETH market cap – $408 billion
- ETH total supply – 120 million
- ETH circulating supply – 120 million
- ETH ranking – #2
The Ethereum price has been on a downtrend since 27 May, when it faced resistance around the $4000 mark, dropping within a falling wedge pattern. Additionally, ETH has been down 7% in the past week. However, it is showing signs of recovery, as it has retested its support level of $3,372.
ETH is trading with a bearish bias, consolidating within a falling wedge channel. This hints at a significant upward breakout, committing the coin to more gains.
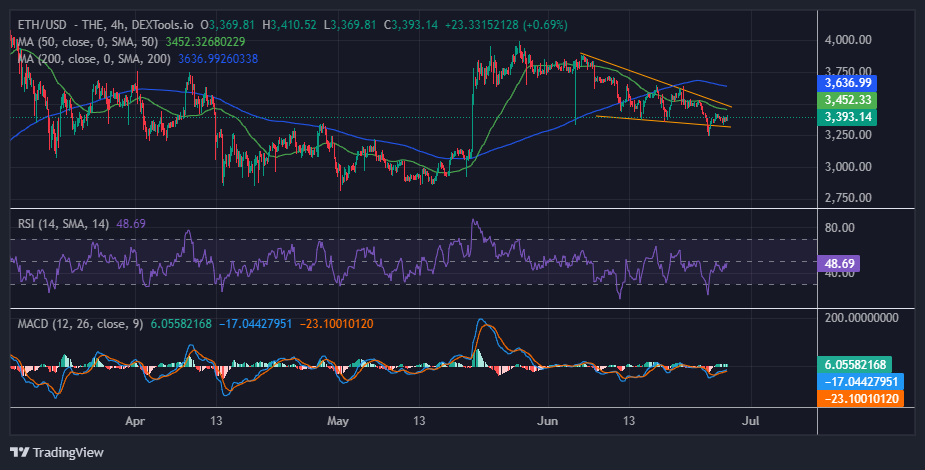
The formation of a falling wedge pattern suggests the potential for a bullish reversal in prices, which could prompt bullish investors to push prices higher.
Currently, the ETH price is trading below both the 50-day and 200-day simple moving averages (SMAs), with $3,452 and $3,636 acting as the immediate resistance keys. However, the bulls aim to break out above the falling wedge pattern to kickstart a rally.
The Relative Strength Index (RSI) is showing signs of recovery, hovering around the 48 mark, just below the midline of 50. This indicates significant selling pressure on ETH’s price. If bullish momentum increases, it could push the RSI into the overbought territory, confirming the anticipated bullish rally.
Meanwhile, the Moving Average Convergence Divergence (MACD) indicator is currently bullish. The blue average line has crossed above the orange signal line towards the neutral level, suggesting a shift in momentum. Further, the signal line is hurtling towards the positive territory, which signals that the bulls could trigger an upward trend.
Ethereum Price Prediction: Will The ETH Bulls Trigger The Anticipated Rally?
The ETH price in the 4-hour chart analysis shows a critical juncture. Bulls are defending the upward momentum, aiming to regain momentum towards the $4000 mark. However, the presence of a falling wedge pattern offers support for the bullish sentiment as bulls seek to drive the price to $4200.
Conversely, if the bears are aggressive and the overall crypto market outlook is negative, they could pave the way for a downside towards the $3246 support level, slightly below the wedge’s lower trendline. Traders and investors should monitor these levels closely for potential market sentiment and price action shifts.
Bottom Line
As the launch of spot Ethereum ETFs is expected any day now, some market analysts are bullish. They expect the price to surge to over $7,000.
While the bulls show resilience and aim to break above the pattern, suggesting a potential rally to higher levels, the bearish indicators and patterns suggest caution.
Traders should closely monitor these support and resistance keys as well as the major indicators for clearer directional cues to evade losses.
Read More
- Analyst Forecasts Altcoins Surge, Sees Bitcoin Rebound
- DePIN Crypto Projects to Watch In 2024 – Top 10 DePIN Coins
- Best Metaverse Coins to Invest – Next Metaverse Coins

Advertisement


